Are you interested in gathering data on healthy behaviors or outcomes in your county? Or are you interested in gathering insight on the leading agricultural products in your county? You can gather data on these as well as much more information through our new Community Data Report Tool!
The Community Data Report is a powerful resource for discovering risk factors, health outcomes, and community assets in your county or public health region. Previously hosted on the Rural Opioid Response website, the Community Data Report is a collaborative project with the MU Extension’s Center for Applied Research and Engagement Systems (CARES).
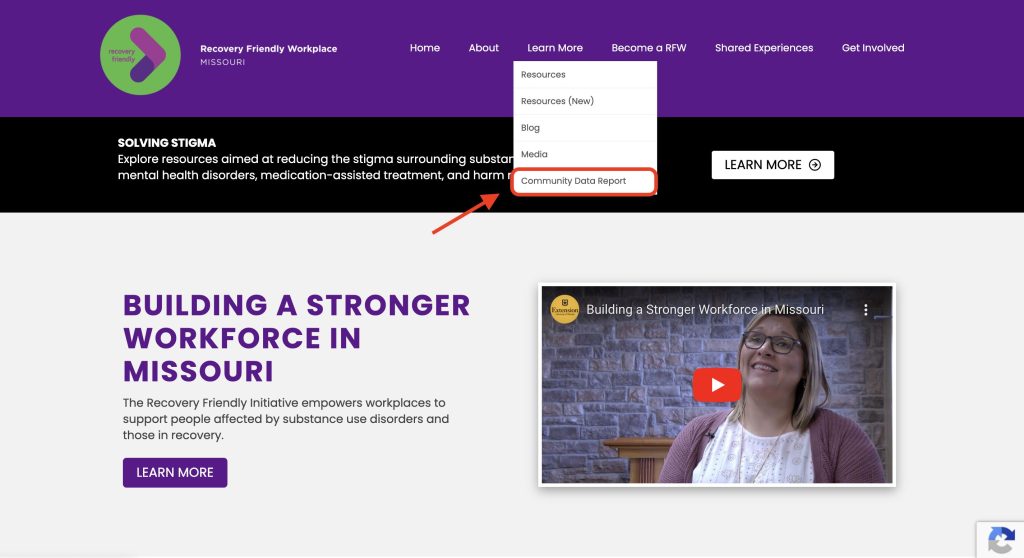
The Community Data Report allows you to quickly and easily create customized reports for your county, public health region, or the state of Missouri. Navigate to the Community Data Report by visiting www.recoveryfriendlymo.com and selecting “Community Data Report” from the dropdown beneath the “Learn More” navigation item (Figure 1).
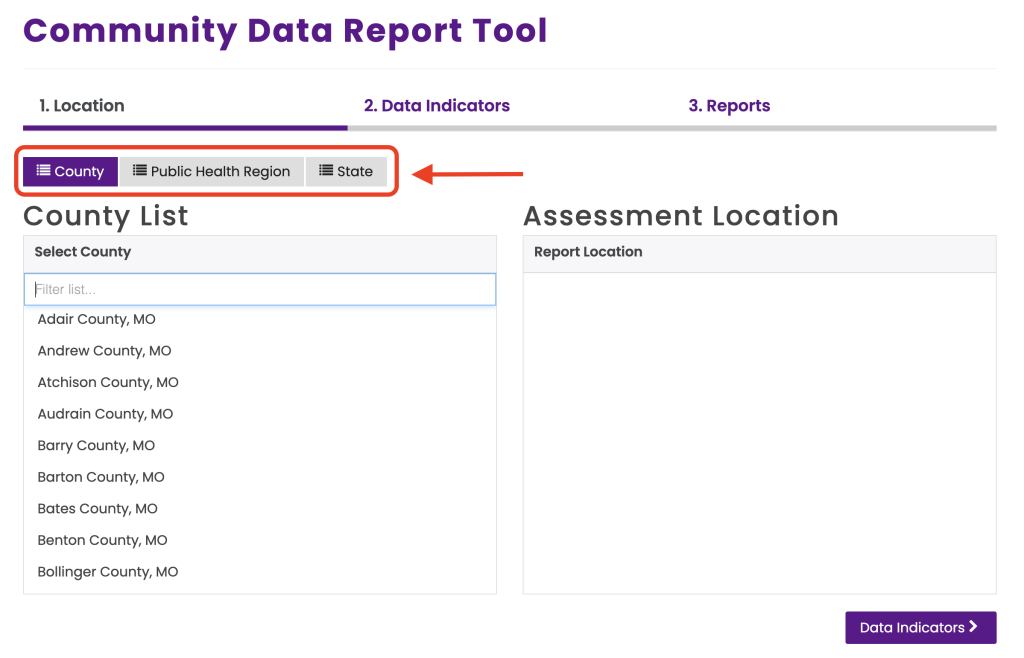
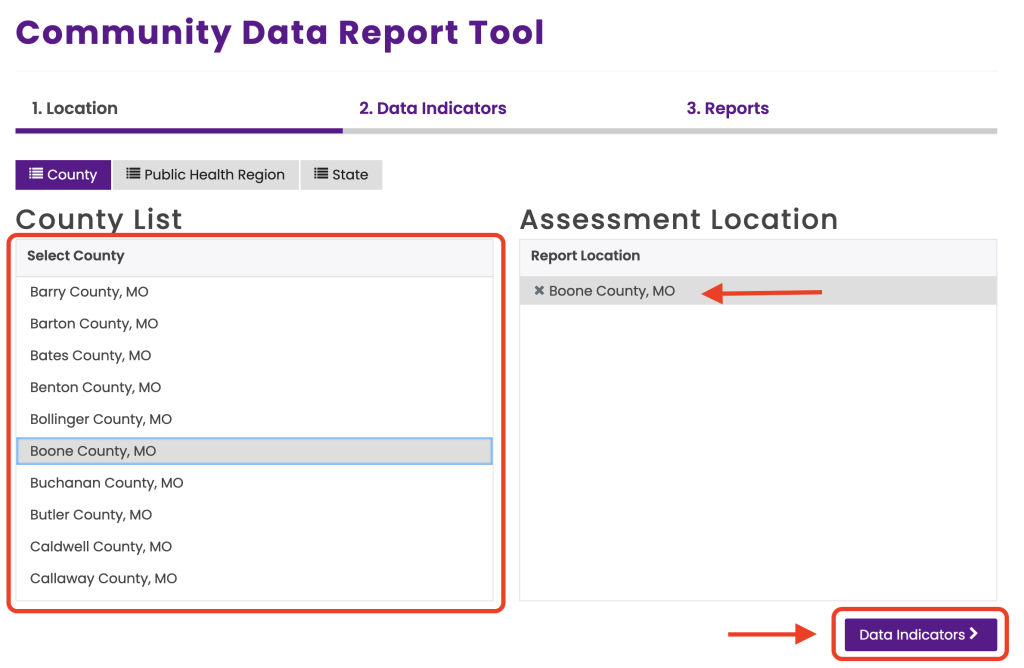
To build a report, first select your location of interest. Click the location tabs at the top of the screen to select a location type (Figure 2), then click the names of one or more locations from the list that appears (Figure 3). Click the “Data Indicators” button at the bottom right to move to the next step.
Next, select the data you want to include in your report. The data in this report are aggregated from a wide variety of state-level sources (including the Missouri State Highway Patrol, Department of Social Services, and Department of Health and Senior Services), as well as national-level sources (including the CDC National Vital Statistics System, the CDC Behavioral Risk Factor Surveillance System, and the US Bureau of Economic Analysis). The data are updated in accordance with updates from our sources.
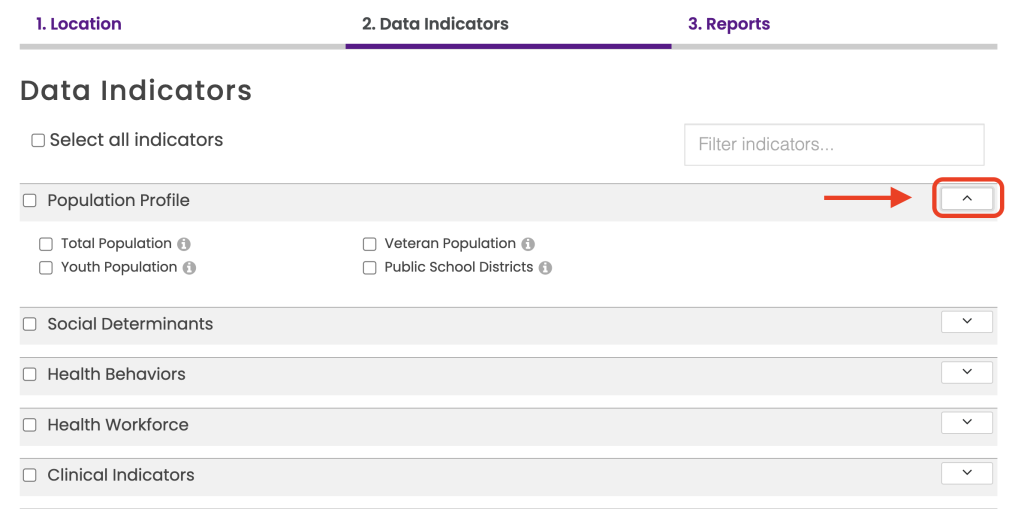
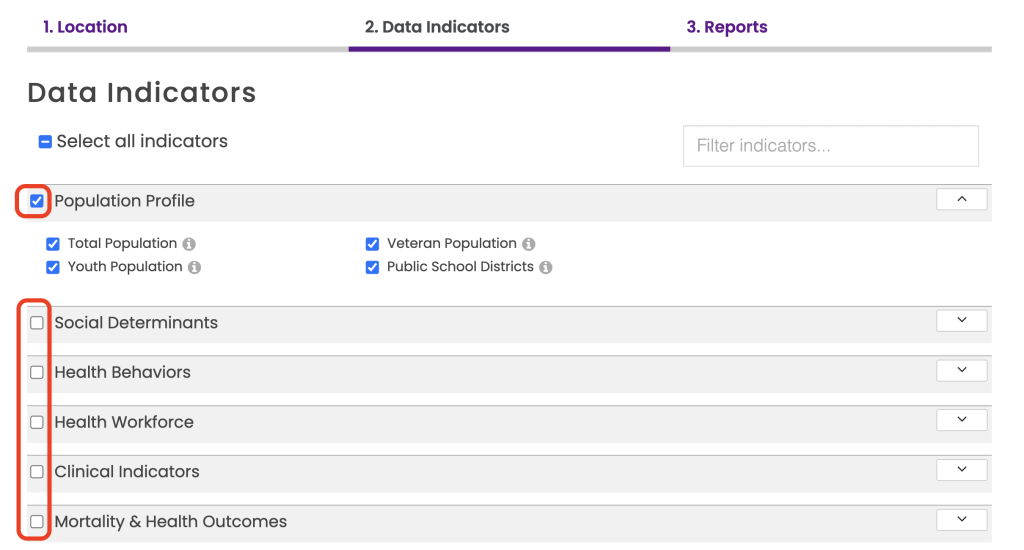
To select your data of interest, first, use the carets on the right to expand the data categories (Figure 4). Then, click the check box next to an indicator name (e.g., Total Population, Youth Population) to add single indicators to your report, or click the check box next to a data category name (e.g., Population Profile, Social Determinants, Health Behaviors) to add an entire data category to your report (Figure 5).
Click the “Reports” button at the bottom right to generate your report. Your report will feature tables, charts, graphs, maps, and written explanations for your selected indicators and location (Figure 6). Many indicators also include data breakouts by age, gender, race, and ethnicity. Use these reports to support community needs assessments and improvement plans, grant applications, and day-to-day research.
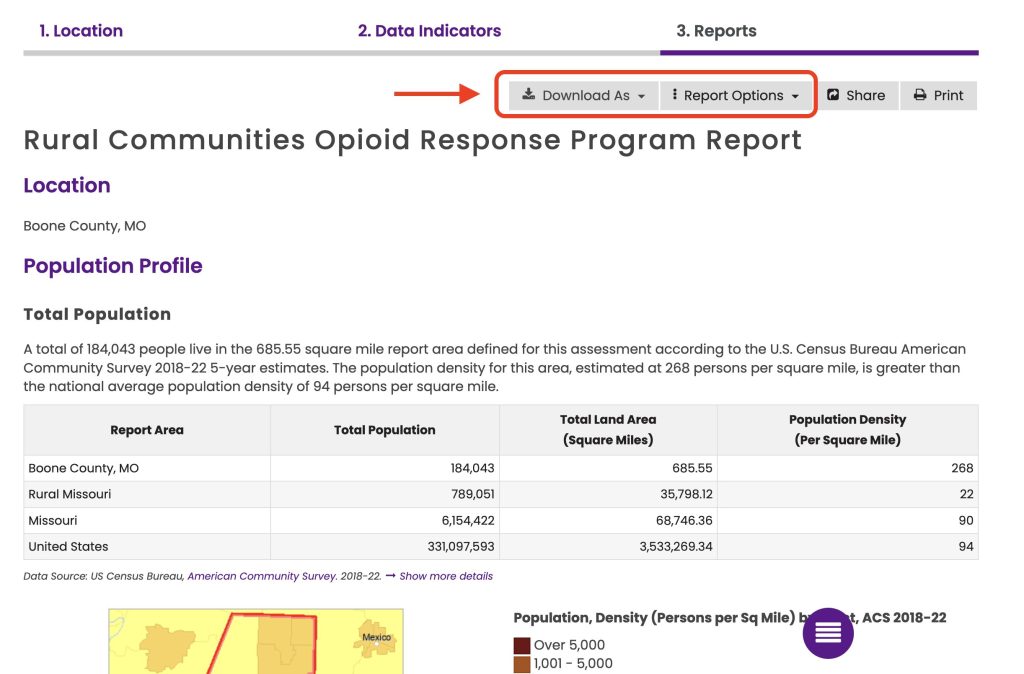
To export your report, click the “Download As” button to download it as a PDF file, Excel table, or Microsoft Word document. Click the “Share” button at the top of the report to share your report via link, email, or on social media. If you have questions about the Community Data Report, please contact the CARES team at help@cares.missouri.edu.
This blog post was written by Jordan Rhodes, Project Support Coordinator working for the University of Missouri Extension’s Center for Applied Research and Engagement Systems (CARES) Team.

